AWS Elastic Load Balancer Monitoring Integration
Amazon's Elastic Load Balancing service automatically distributes incoming application requests across multiple targets - EC2 instances, containers and network interfaces. Site24x7's integration with AWS ELB helps you monitor key performance metrics pertaining to ELB nodes and targets for all types of Elastic Load Balancers - Network, Application and Classic.
Setup and configuration
- If you haven't done it already, enable Site24x7 access to your AWS resources by either creating an IAM user or a cross-account IAM Role. Learn more.
- Then, in the Integrate AWS account page, please make sure the Elastic Load Balancer check box is selected in the Services to be discovered field. Learn more.
Policy and permissions
The following ReadOnly permissions are required to be assigned to the created IAM or cross-account Role to help discover and monitor Elastic Load Balancer nodes.
- "elasticloadbalancing:DescribeLoadBalancers",
- "elasticloadbalancing:DescribeTags"
- "elasticloadbalancing:DescribeListeners",
- "elasticloadbalancing:DescribeAccountLimits",
- "ec2Instance:describeVpcEndpoints",
- "ec2Instance:describeVpcEndpointServiceConfigurations"
Polling interval
Site24x7 polls the CloudWatch API and other service level APIs as per the poll frequency set (1 minute to a day), to collect performance metrics and metadata.
Supported performance counters
Classic Elastic Load Balancer metrics
| Metric name | Description | Statistics | Unit |
|---|---|---|---|
| Backend connection errors | Measures the number of connections that were not successfully established between the load balancer and backend EC2 instances. | Sum | Count |
| Latency | (HTTP listener) Measures the total time elapsed in seconds, after the request leaves the load balancer until a response header is received from the instance. (TCP listener) Measures the time elapsed in seconds, to successfully establish a TCP connection with the instance. |
Average | Seconds |
| Healthy host count | Measures the number of healthy EC2 instances registered to the classic Elastic Load Balancer node per Availability Zone. | Maximum | Count |
| UnHealthy host count | Measures the number of unhealthy instances per Availability Zone for your Classic Elastic Load Balancer node. | Maximum | Count |
| Request count | (HTTP listener) Measures the total number of requests that were received and routed to the registered instances. (TCP listener) Measures the total number of connections established with the registered instance. |
Sum and average | Count |
| Spillover count | Measures the total number of requests that were dropped due to the surge queue getting full. | Sum | Count |
| Surge queue length | Measures the maximum number of requests that are pending submission to a registered backend instance. | Maximum | Count |
| ELB 4XX errors | The number of HTTP 4XX client error response codes generated by the load balancer. | Sum | Count |
| ELB 5XX errors | The number of HTTP 5XX server error response codes generated by the load balancer. | Sum | Count |
Classic ELB configuration details
| Attribute name | Description |
|---|---|
| ELB name | The name of the Load Balancer. |
| Region | The name of the Region where the Classic Load Balancer was created. |
| Availability zones | The Availability Zone where the Classic Elastic Load Balancer node was created. |
| DNS name | The DNS name for the load Balancer. |
| Scheme | The type of load balancer in use - internal facing or external facing. |
| VPC-ID | For load balancers that are deployed with in a VPC. |
| Security groups | List of security groups attached to the classic load balancer within the VPC. |
| Creation time | The time when the Classic Elastic Load Balancer node was created. |
| Connection timeout | Idle connection time out for your ELB node. |
| Instances | IDs of EC2 instances registered to the load balancer. |
| Interval | Configured health check interval. |
| Response timeout | The amount of time to wait when receiving a response from the health check. |
| Ping target | The protocol and the port to use when connecting to the EC2 instance. |
See how you can add a threshold profile for your monitored classic load balancer.
Target Groups
A Target Group is a collection of targets (such as EC2 instances, IP addresses, or Lambda functions) that an Application Load Balancer, Network Load Balancer, or Gateway Load Balancer routes traffic to.
In the Target Groups tab, you can view the Target Groups attached to your AWS ELB, configuration details of individual Target Groups, and CloudWatch metrics. Additionally, you can also view the number of Healthy Hosts and Unhealthy Hosts in each Target Group.
- This tab is available for Application Load Balancer, Network Load Balancer, and Gateway Load Balancer monitors (except the Classic Load Balancer monitor).
- The Target Groups tab displays a maximum of 40 target groups attached to your AWS ELB.
- You can assign your Target Group with the custom tag key monitor_site24x7 and set its value to false in the AWS console. Any Target Group with this tag and value set to false will be ignored during the discovery of Target Groups. To revert this behavior, remove the tag from the resource, and the changes will be updated in the next poll.
In the below image, you can view the number of Healthy Hosts and Unhealthy Hosts for a Target Group in an Application Load Balance monitor.
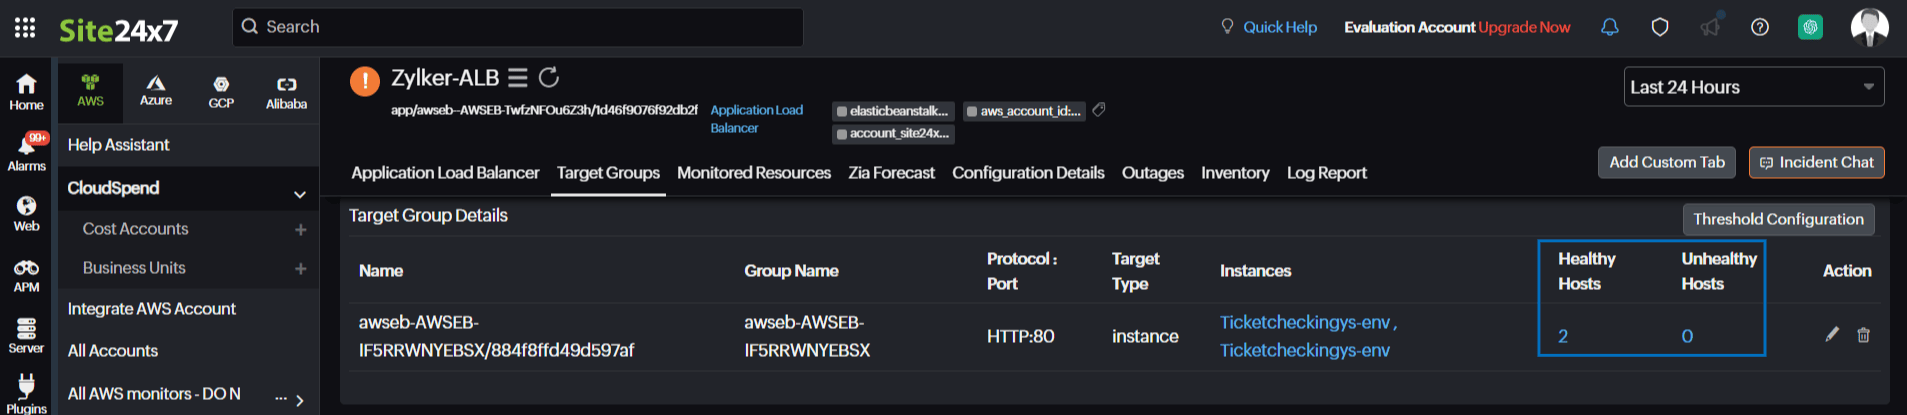
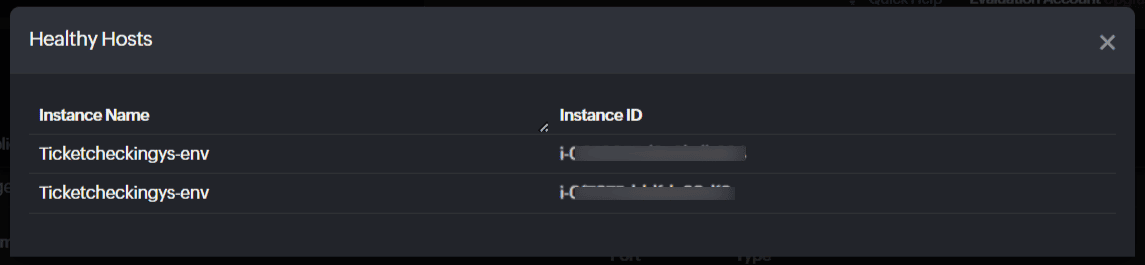
Click the Healthy Hosts number to view the instances and their ID, contributing to the Healthy Hosts. Similarly, you can also view the Unhealthy Hosts details.
Monitored resources
View a list of monitored EC2 Instances associated with your elastic load balancer. Click on an individual listing to see performance and resource usage stats associated with that resource. You can also set thresholds and be notified when any of these services fail by clicking the pencil icon under Action.
Forecast
Estimate future values of the following Classic Elastic Load Balancer performance metrics and make informed decisions about adding capacity or scaling your AWS infrastructure:
- Spillover Count
- Surge Queue Length
Resource-Level Topology
The Topology View tab delivers a live, resource-centric dependency map. It dynamically traces how your ELB resource is connected to its surrounding AWS infrastructure in real time, enabling faster root cause isolation when alerts fire. If any connected component is in a Critical state, it is marked accordingly within the topology view, along with the outage reason, so you can pinpoint the exact failure point without needing to navigate away from the monitor page. Unlike account-wide topology views, this tab scopes visualization to a single resource, answering the precise question: What does this ELB resource connect to, and what breaks if it does?You can trace the full dependency chain from the individual resource up through its primary parent entities to the Service type, Region, and AWS account levels.
Related topics